


新一代架构
资源指标:metrics-server
自定义指标:prometheus、k8s-prometheus-adapter
核心指标流水线:由kubelet、metrics-server以及API server提供API组成、CPU累计使用率、内存实时使用率、pod的资源占用率以及容器磁盘占用率
监控流水线:用户系统手机各种指标数据并提供终端用户、存储系统以及HPA、他们包含核心指标及许多非核心指标。非核心指标本身不能被k8s所解析。
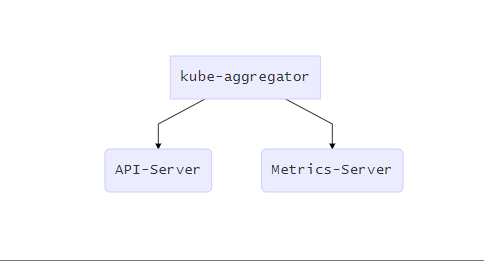
kube-aggregato: 聚合器,/apis/metrics.k8s.io/v1beta1
graph TD
A[kube-aggregator] --> B(API-Server)
A[kube-aggregator] --> C(Metrics-Server)
Metics-Server安装
for file in auth-delegator.yaml auth-reader.yaml metrics-apiservice.yaml metrics-server-deployment.yaml metrics-server-service.yaml resource-reader.yaml ;do wget https://raw.githubusercontent.com/kubernetes/kubernetes/master/cluster/addons/metrics-server/$file ; done
或者本人使用如下配置:
1、git clone https://github.com/kubernetes-incubator/metrics-server.git
cd metrics-server/deploy/1.8+
2、在metrics-server-deployment.yaml中新增如下配置:
    - /metrics-server
   - --kubelet-preferred-address-types=InternalIP
       - --kubelet-insecure-tls
    - --metric-resolution=30s
完整例子如下:
---
apiVersion: v1
kind: ServiceAccount
metadata:
  name: metrics-server
  namespace: kube-system
---
apiVersion: extensions/v1beta1
kind: Deployment
metadata:
  name: metrics-server
  namespace: kube-system
  labels:
    k8s-app: metrics-server
spec:
  selector:
    matchLabels:
      k8s-app: metrics-server
  template:
    metadata:
      name: metrics-server
      labels:
        k8s-app: metrics-server
    spec:
      serviceAccountName: metrics-server
      volumes:
      # mount in tmp so we can safely use from-scratch images and/or read-only containers
      - name: tmp-dir
        emptyDir: {}
      containers:
      - name: metrics-server
        image: k8s.gcr.io/metrics-server-amd64:v0.3.3
        imagePullPolicy: IfNotPresent
        volumeMounts:
        - name: tmp-dir
          mountPath: /tmp
        command:
        - /metrics-server
        - --kubelet-preferred-address-types=InternalIP
        - --kubelet-insecure-tls
        - --metric-resolution=30s
kubectl apply -f . kubectl proxy --port 8080 curl http://127.0.0.1:8080/apis/metrics.k8s.io/v1beta1/nodes
prometheus部署
k8s集群上部署Prometheus并提供自定义指标的配置清单项目地址
git clone https://github.com/iKubernetes/k8s-prom.git

drwxr-xr-x 2 root root 4.0K Jun 30 19:47 k8s-prometheus-adapter
drwxr-xr-x 2 root root  115 Jun 30 19:47 kube-state-metrics
-rw-r--r-- 1 root root   58 Jun 30 19:47 namespace.yaml
drwxr-xr-x 2 root root   65 Jun 30 19:47 node_exporter
drwxr-xr-x 2 root root   57 Jun 30 19:47 podinfo
drwxr-xr-x 2 root root  118 Jun 30 19:47 prometheus
-rw-r--r-- 1 root root  540 Jun 30 19:47 README.md
prometheus目录:部署Promethues Metrics API Server所需要的各资源配置清单。
k8s-prometheus-adapter目录:部署基于prometheus的自定义指标API服务器所需要的各资源配置清单。
podinfo目录:测试使用的podinfo相关的deployment和service对象的资源配置清单。
node_exporter目录:于kubernetes集群各节点部署node_exporter。
kube-state-metrics:聚合kubernetes资源对象,提供指标数据。 转换成k8s能识别的数据
参考:https://github.com/stefanprodan/k8s-prom-hpa
kubectl apply -f namespace.yaml
cd node_exporter
kubectl apply -f .
cd ../prometheus
kubectl apply -f .

http://nodeIP:30090

#转换为k8s可识别的信息POD
cd ../kube-state-metrics
kubectl apply -f .
#配置证书
cd /etc/kubernetes/pki
(umask 077; openssl genrsa -out serving.key 2048)
openssl req -new -key serving.key -out serving.csr -subj "/CN=serving"
openssl x509 -req -in serving.csr -CA ./ca.crt -CAkey ./ca.key -CAcreateserial -out serving.crt -days 3650

kubectl create secret generic cm-adapter-serving-certs --from-file=serving.crt=./serving.crt --from-file=serving.key=./serving.key -n prom

cd ../k8s-prometheus-adapter
kubectl apply -f .

kubectl get all -n prom

https://raw.githubusercontent.com/DirectXMan12/k8s-prometheus-adapter/master/deploy/manifests/custom-metrics-config-map.yaml

https://raw.githubusercontent.com/DirectXMan12/k8s-prometheus-adapter/master/deploy/manifests/custom-metrics-apiserver-deployment.yaml

vim 该以上命名空间为porm ,再次kubectl apply 即可

curl http://127.0.0.1:8080/apis/custom.metrics.k8s.io/v1beta1/
结合gafana
apiVersion: apps/v1
kind: Deployment
metadata:
  name: monitoring-grafana
  namespace: prom
spec:
  replicas: 1
  selector:
    matchLabels:
      task: monitoring
      k8s-app: grafana
  template:
    metadata:
      labels:
        task: monitoring
        k8s-app: grafana
    spec:
      containers:
      - name: grafana
        image: k8s.gcr.io/heapster-grafana-amd64:v5.0.4
        ports:
        - containerPort: 3000
          protocol: TCP
        volumeMounts:
        - mountPath: /etc/ssl/certs
          name: ca-certificates
          readOnly: true
        - mountPath: /var
          name: grafana-storage
        env:
       #- name: INFLUXDB_HOST
       #  value:  monitoring-influxdb
        - name: GF_SERVER_HTTP_PORT
          value: "3000"
          # The following env variables are required to make Grafana accessible via
          # the kubernetes api-server proxy. On production clusters, we recommend
          # removing these env variables, setup auth for grafana, and expose the grafana
          # service using a LoadBalancer or a public IP.
        - name: GF_AUTH_BASIC_ENABLED
          value: "false"
        - name: GF_AUTH_ANONYMOUS_ENABLED
          value: "true"
        - name: GF_AUTH_ANONYMOUS_ORG_ROLE
          value: Admin
        - name: GF_SERVER_ROOT_URL
          # If you're only using the API Server proxy, set this value instead:
          # value: /api/v1/namespaces/kube-system/services/monitoring-grafana/proxy
          value: /
      volumes:
      - name: ca-certificates
        hostPath:
          path: /etc/ssl/certs
      - name: grafana-storage
        emptyDir: {}
---
apiVersion: v1
kind: Service
metadata:
  labels:
    # For use as a Cluster add-on (https://github.com/kubernetes/kubernetes/tree/master/cluster/addons)
    # If you are NOT using this as an addon, you should comment out this line.
    kubernetes.io/cluster-service: 'true'
    kubernetes.io/name: monitoring-grafana
  name: monitoring-grafana
  namespace: prom
spec:
  # In a production setup, we recommend accessing Grafana through an external Loadbalancer
  # or through a public IP.
  # type: LoadBalancer
  # You could also use NodePort to expose the service at a randomly-generated port
  # type: NodePort
  ports:
  - port: 80
    targetPort: 3000
  type: NodePort
  selector:
    k8s-app: grafana
➜ ~ kubectl get svc -n prom monitoring-grafana NodePort 10.103.14.52 <none> 80:31479/TCP 8s http://NodeIP:31479 改源数据prometheus http://prometheus.prom.svc:9090 保存 ➜ ~ kubectl get svc -n prom prometheus NodePort 10.99.219.125 <none> 9090:30090/TCP 70m 查找模板:https://grafana.com/dashboards?search=kubernetes Kubernetes Cluster (Prometheus) Download JSON


 桂ICP备16010384号-1
停留在世界边缘,与之惜别